
6-6-24 – By Josh Booth – @bridge2buctober on X
IT’S, SORT OF, UNDERSTOOD
Most of you are aware of Bryan Reynolds having success in the month of June.
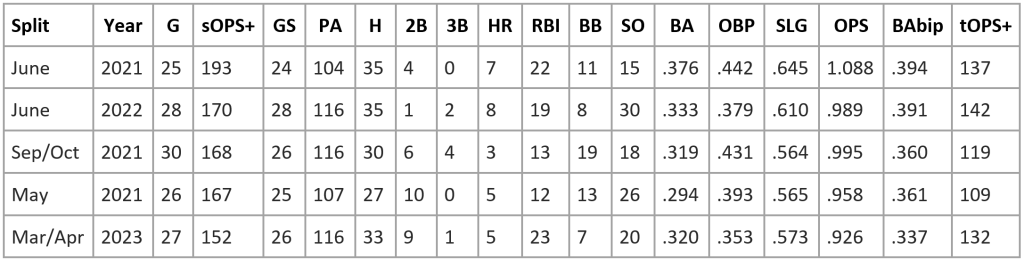
In the last 3 seasons, his best month was June 2021, when he went on a hitting rampage. I believe it was that month that fans, collectively, considered June as his month to click. As you’ll see below, June 2022 was his second best month in the last 3 years.
We’re going to use the Split OPS+ for proof. Split OPS+, sOPS+, takes the league’s average OPS for that specific split (month, in this case) and makes that 100. Above average is higher than 100 and below average is lower. sOPS+ is NOT park adjusted.
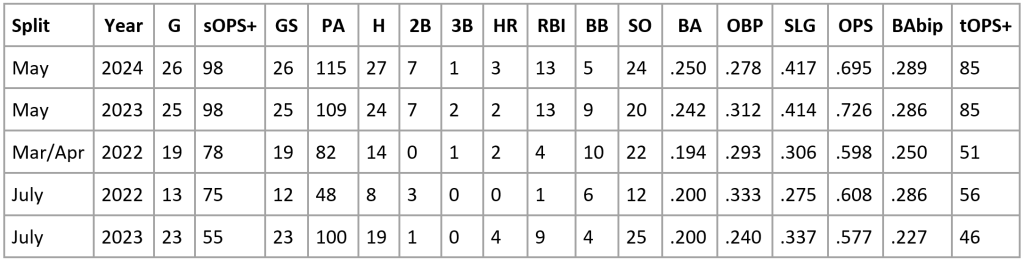
Bryan Reynolds has only been a below average hitter in 5 months of the last 20, going back to the beginning of 2021.
From 2021 – 2024, his 5 worst months:
His best 5 months:
Where’s June 2023? Well, he had a 123 sOPS+. However, he only hit 1 HR in 16 Games. He walked 12 times and only struck out 15. So, despite his .268 AVG and .393 SLG being the lowest June in this sample, he had a .406 OBP, bumping his OPS up to .799.
THE TRENDS
We understand, now, that he’s typically a June guy. Does that hold up? What was leading up to that?
Mar/Apr of ’21, Reynolds hit 2 HR in 25 games, a .792 OPS, and even had a .278 AVG with a .350 BABIP.
In May of ’21, he bounced back to a .294 AVG and .958 OPS; knocking 5 HR before going on a tear in June of ’21.
Mar/Apr of ’22, a .194 in 19 G. .598 OPS. In May, he improved to a .225 AVG and .758 OPS, thanks to hitting 5 HR and walking 11 times. He then hit a month-best 8 HR in June and a .989 OPS.
2023 was a little more interesting than the last two. He began on a tear. .320 AVG and .926 OPS with 5 HR in Mar/Apr.
In May, he began to struggle to a .242 AVG and .726 OPS with 2 HR. When June hit, something seemed wrong. I mentioned his numbers above, but why just 16 games?
On June 20th, he was added to the IL for lower back inflammation. You can assume that he was dealing with that prior to being placed on the IL. After being activated, he played in 23 games in July. He wasn’t right until late July and into August.
You can look that up or just take my word for it.
2024
In 2024, Mar/Apr started out with a .248 AVG and .743 OPS; hitting 4 HRs and walking 20 times. Knocked down a little by a .289 BABIP, he still had a sOPS+ of 114.
Then in May, we saw him dip a little. .695 OPS and .250 AVG dropped to a 98 sOPS+. You can see this in the chart above, it was one of his worst months of this sample. I mean, he went from walking 20 times in Mar/Apr to walking only 5 times in May. While he raised his SLG in May, his OBP dropped from .355 to .278.
I think it’s adjustment time.
LET’S DIG DEEPER
In those first 3 months of 2021 (technically 4 because it includes March), Reynolds improved month-by-month in several statistics.
AVG – .278 to .293 to .376.
HR – 2 to 5 to 7.
OBP – .381 to .387 to .437.
Despite increasing his K% 3.5% and decreasing his BB% by 2%.
One of the weirdest things about May 21:
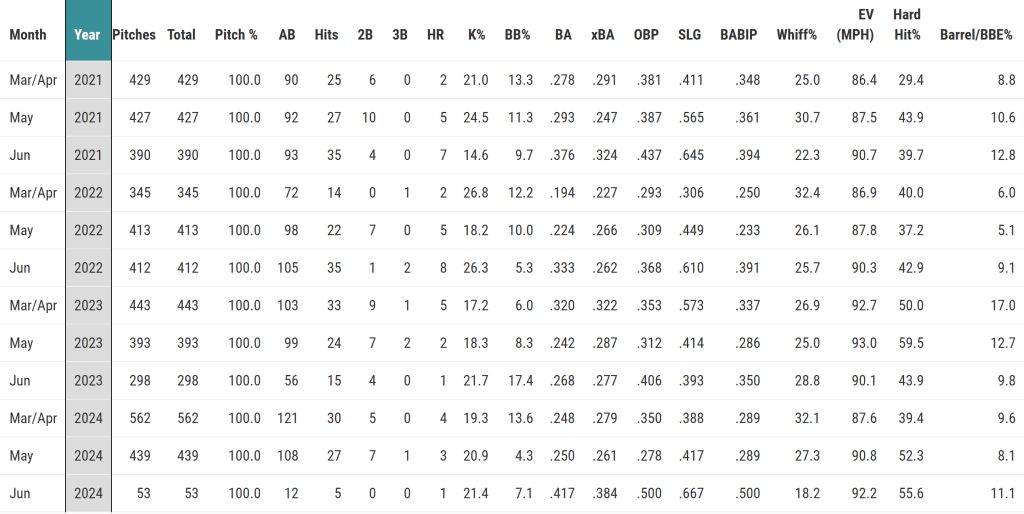
Reynolds increased his AVG 15 points, in part, due to a 13-point increase to his BABIP. You can see proof of that increase in some Statcast data. His Barrel% increased almost 2% and his Hard Hit% (95+ EV) increased from 29.4% to 43.9%! This resulted in 4 more doubles (10) and 3 more HR (5) over the previous month. Statcast xBA (Expected Batting AVG) dropped to .247, though, making it so interesting.
In June 2021, the Whiff% dropped, the exit velocity went up, the HardHit% stayed close, Barrel% went up another 2%, BABIP skyrocketed to .394, xBA at .324, and he dropped his K% to just 14.6%. Doubles turned into HR, as he hit 7 cannonballs that month.
Take that line into consideration and look at the graph below. This is Mar/Apr, May, and June from the last 3 seasons. Also, keep note of 2023 and the injury I talked about earlier.
ANCHOR DAHN
The first two months of 2024 have some similarities to previous seasons leading up to June. You could make a case that they are trending similar but the numbers, themselves, a bit better. When it comes to quality of contact in hard hits and barrels, those numbers are higher than they’ve been in 21 or 22. They are all around, though.
There are a lot of outside factors that could go into something to this nature. For example, it could be as simple as the weather warming up and the player prefers warmer weather.
They don’t play MLB games on paper – or computer screens, in this case. But if we are going to use the numbers in front of us to project forward, I would lean on the side of history and suggest that Reynolds is due for another big June.
Maybe we’ll look back at this and say “we saw it coming!” Then again, maybe we’ll have something else to dig into, finding reasons it didn’t pan out the way we thought it might. Either way, I think it’s reasonable to expect good things from #10 this month.
